This page demonstrates mainly the routing feature of Cirrugator. It is only an excerpt from the full Cirrugator site, showing the most recent data available. In addition it offers some guidance to better understand these complex options and graphs, including the use of historic data (recommended for a first look) rather than most recent data. For even more details and your own in-depth analysis go directly to Cirrugator's home at www.cirrugator.com.
- Click the 'Show Guidance' link to read an explanation of what you see on the graph and how to interpret it, click the link again to hide the text.
- Datapoints are mouse-sensitive: rest the mouse pointer over them to get details. Some also respond to clicks.
- For a first look you may choose the historic data with interpretation instead of the most recent data (the startup default). You may use these links to switch back and forth at any time.
|
Best Routing for Cirrus
Show Guidance
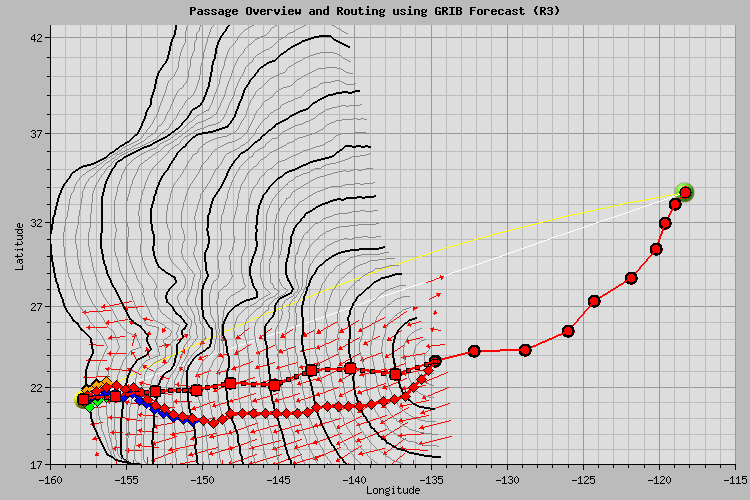
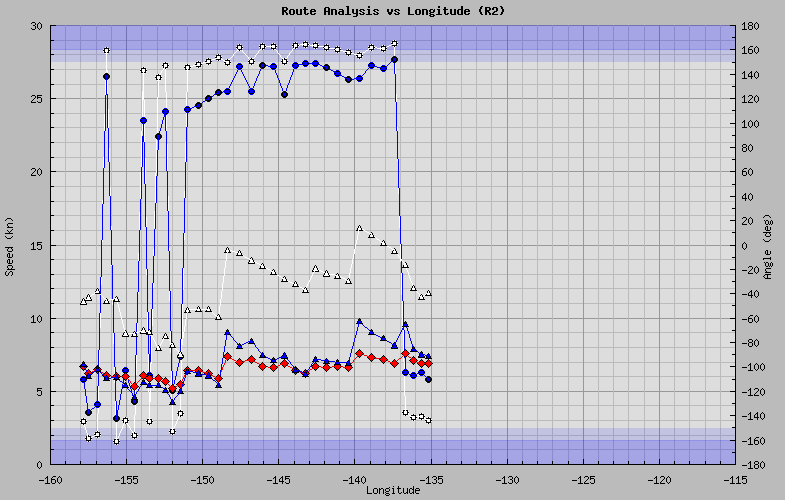
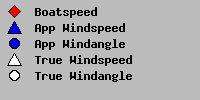
Historic Data These graphs represent a retrospective analysis of the 2007 Transpac race. On the morning of 2007-07-18 Cirrus was at about 24N/135W. The GRIB file of that morning (see below) gave no reason for real concern. Cirrugator suggested to take a detour and go south, before heading up for Hawaii. Taking detours is not exactly on the mind of racers! A feature added later in Cirrugator version 2.2 allows to enter freely chooseable waypoints and calculates the route along these waypoints. Using that it turned out that the detour would have been about 1/2 day faster! Close inspection of the Route Analysis graph tells that it would have been due to the better, but still well manageable, windangle. The red squares are the entered waypoints. They are sitting atop Cirrus' actual positions. Alas, such is the fun of Monday-morning-quarterbacking... |
|
|
GRIB Ref. Date (UTC): 2007-07-18 0000 Time to go (red route): 9.12 days Last position at: Friday, 2007-07-27 0118 PDT ETA (red route): Sunday, 2007-08-05 0410 PDT |
|
|
|
GRIB Weather
Show Guidance
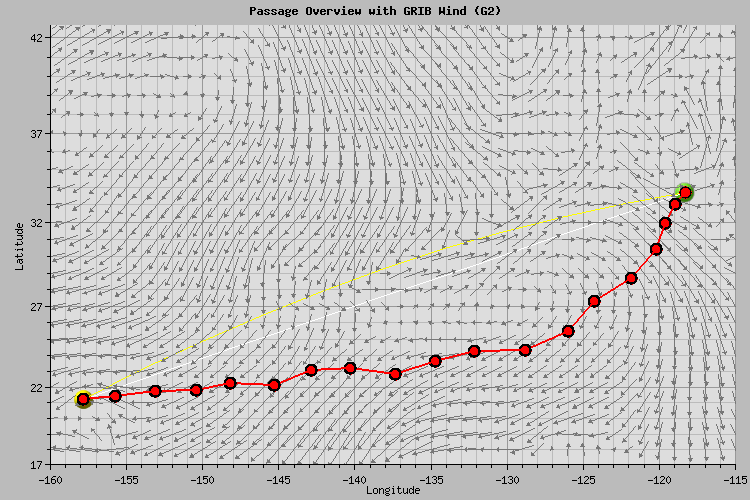
Historic Data This is the day 0 (GRIB Valid Date +0d) wind pattern as determined from the GRIB file used for the routing example described above. Nothing of concern is visible here, although a disturbance is developing a few days later, which, however, can only be seen by using Cirrugator to look a the full sequence of GRIB graphs. (You find this under the GRIB menu in Cirrugator) |
|
|
File: grib20070718-0609-00688.grb
GRIB Ref. Date (UTC): 2007-07-18 0000 GRIB Valid Date (UTC): 2007-07-18 0000 ( + 0 d) |
|
Weather Fax
Show Guidance
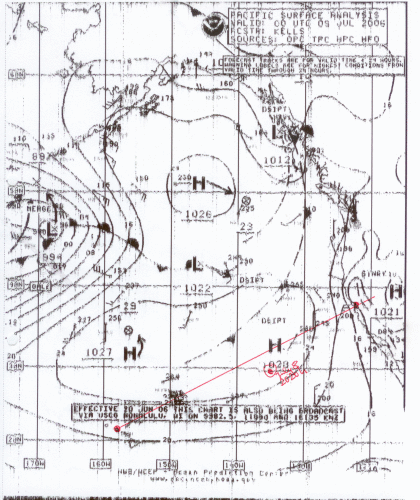
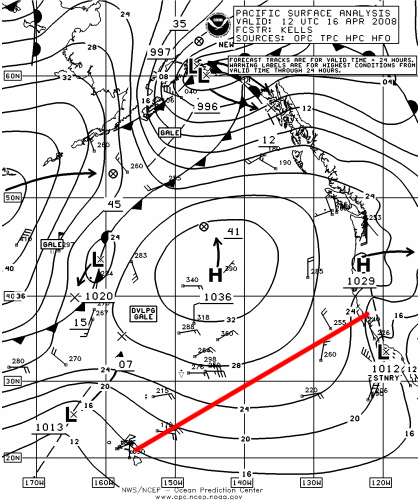
Historic Data The left side picture is a surface analysis from July 9, 2006, i.e. we were about one week into the Pacific Cup 2006. It is scanned-in from a paper copy of the radio fax from that day; actually quite a decent quality compared to some other days! Note the red line from San Francisco to Hawaii - representing the rhumb line - and our position as a red dot. We are uncomfortably close to the center of a High, meaning: there is little wind. This was before routing from Cirrugator became available; hopefully Cirrugator will help us to avoid such situations in the future. This is also not what a Pacific summer weather is supposed to look like. The famous summer-defining 'Pacific High' is supposed to sit in about the center of this graph, with no other Highs, Lows, fronts or else between the rhumb line and the High, and supposed to remain so for, well, the summer. It would look almost like the right side picture, although this one is from April 16, 2008 (and it is not stable at all).
|
|
|
|
|
Corrected Time and PCR rating
Show Guidance
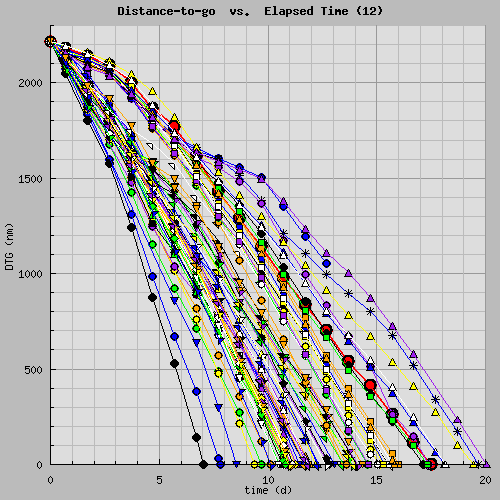
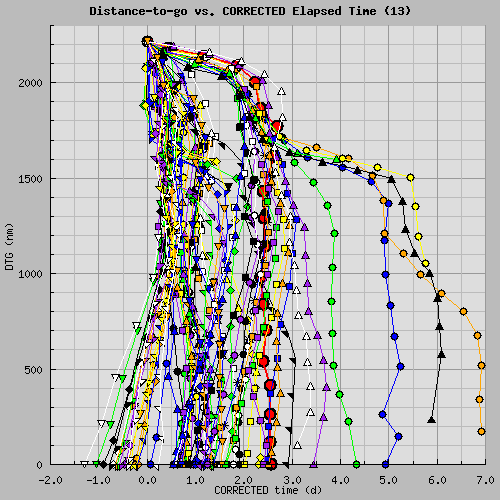
Historic Data The graphs show the complete set of data from the Transpac 2007 race. In the left-side graph you will notice a slight downward curvature of the lines for most boats, indicating that the race started slow but then became a little bit faster. The leftmost black line is from Pyewacket, the fastest boat of the race (but they did not win!). Most of the boats 'rained' down on the finish line from day 10 to day 15 of elapsed time. But you can't say anything about how well they performed or what their ranking in the race might be. On the right-side graph - plotted versus the corrected time - note the bundle of lines first swinging to the right, before pointing downwards at about 1800nm DTG, and another bundle going straight down from the beginning. The first bundle is from the first-starting, slow boats who experienced poor wind at the beginning, resulting in underperformance, while the late-starting, fast boats had much better conditions right from the start, performing almost as expected. From about 1200nm downwards, some boats perform better than expectation as seen by their tracks pointing to the left. Most of the others keep up to expectations (vertical track). Overall, it was a slow race, as seen by almost all tracks tending to end on the right of t=0.0 for the finish. The leftmost line is the overall winner (Rainrag), and the ranking goes strictly from left to right. P.S.: The absolute PCR rating is needed here, but since the Transpac race provided only relative PCRs, the missing race-PCR bias was reverse calculated based on Transpac 2005 and Pacific Cup 2006 data |
|
|
|
|
Ranking
Show Guidance
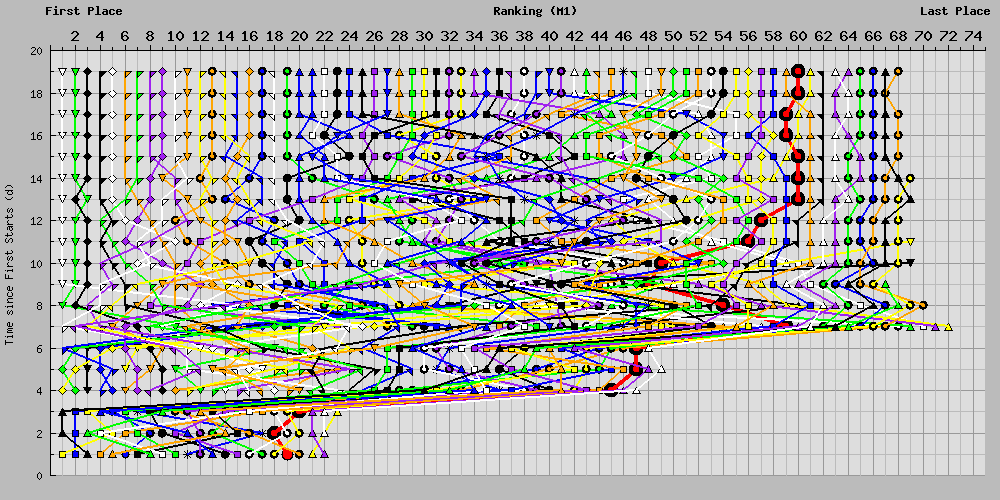
Historic Data The graphs show the complete set of data from the Transpac 2007 race. The steps in the beginning (bottom of graph) result from the boats starting in three day intervals. Note that the best and worst performers are established early on, while the middle of the pack is fighting till the very end! |
|
|
|

|